Profiling
Jul 10, 2018 03:25 · 813 words · 4 minute read
This entire post is dedicated to a description of the various profilers I experimented with. At the start of this project, I didn’t know what profiling was, however, over the last week, I have tried multiple ones. This post expounds my experiences, summarising the relative strengths and weaknesses of each, and describing what I think works best for the PracMLN project in particular.
Built-In Profiling
The first thing to note when profiling is that PracMLN has built-in profiling capabilities. If not using the MLNQuery GUI tool, then the profile=True parameter can be passed explicitly to the query( ... ) tool.
The output of this script is long and arcane, looking something like this:
... $ python3 profiling.py
starting profiler...
===================
PROFILER STATISTICS
===================
         1077566035 function calls (1030510920 primitive calls) in 472.871 seconds

   Ordered by: cumulative time

   ncalls  tottime  percall  cumtime  percall filename:lineno(function)
        1    0.000    0.000  472.859  472.859 /.../pracmln/mln/inference/infer.py:180(run)
        1    4.077    4.077  472.859  472.859 /.../pracmln/mln/inference/exact.py:94(_run)
   524288   33.251    0.000  455.722    0.001 /.../pracmln/mln/inference/exact.py:48(eval_queries)
 10485760   12.677    0.000  228.340    0.000 /.../pracmln/mln/inference/exact.py:172(soft_evidence_formula)
37748736/9437184   40.804    0.000  186.753    0.000 / .../pracmln/logic/common.py:222(gndatoms)
 28835840   29.806    0.000  125.288    0.000 /.../pracmln/logic/common.py:1373(gndatoms)

        .        .        .        .        .        .
        .        .        .        .        .        .
        .        .        .        .        .        .

        2    0.000    0.000    0.000    0.000 {method 'getrandbits' of '_random.Random' objects}
        1    0.000    0.000    0.000    0.000 / ... /pracmln/mln/grounding/default.py:84(_cacheinit)
        1    0.000    0.000    0.000    0.000 {method 'disable' of '_lsprof.Profiler' objects}


exact inference test: 472.885466337204
This is useful, but not very versatile. It makes use of the cProfile module, giving detailed statistics per function used in a particular Python script. The output has 6 columns; ncalls is the total number of times a function is called, totime the total time spent executing the particular function (excluding calls made to other functions), cumtime the total time spent in a functions body (including the time spent in calling other functions from this particular one), percall the average time spent in the function during each invocation (totime/ncalls and cumtime/ncalss, respectively), and finally, the filename:lineno filed points to the location in the code of the function each line refers to.
PyCallGraph
More detailed profiling capability is required for a better understanding. At this point I learnt about PyCallGraph - a profiler that simultaneously creates a colour coded call graph from a Python script.
In the case of PracMLN, however, this is not much more helpful either, with the generated graphs too large to comprehend, reminescent of the earlier UML diagrams:
Vanilla cProfile
It turns out that the default cProfile module that ships with Python is actually extremely powerful, if not very easy to use. Using the same profiling.py script from the gist referenced above, but with line 13 commented instead of line 14 (so that profile=False), the profile can be obtained using the command:
... $ python3 -m cProfile -o profile-data.txt profiling.py
The resultant profile gets stored in the newly created profile-data.txt file, and can now be analysed using another default Python module - pStats. While I did explore this option, I shall not be describing it further here as there are plenty of resources about this already on the internet.
Visualising Profiled Programs
Instead of using pStats, it is arguably simpler to install cprofilev and snakeviz, and then use these in turn to analyse the profile-data.txt file. After simple pip installation, both programs create interactive locally hosted web servers, displaying the contents of the profiling data. This can then be very effectively analysed from any browser.
... $ cprofilev -f profile-data.txt
[cProfileV]: cProfile output available at http://127.0.0.1:4000
cprofilev is a very light wrapper around pStats, allowing easy text-based viewing of the logs, providing basic sorting functionality, and detailed caller/callee information per function.
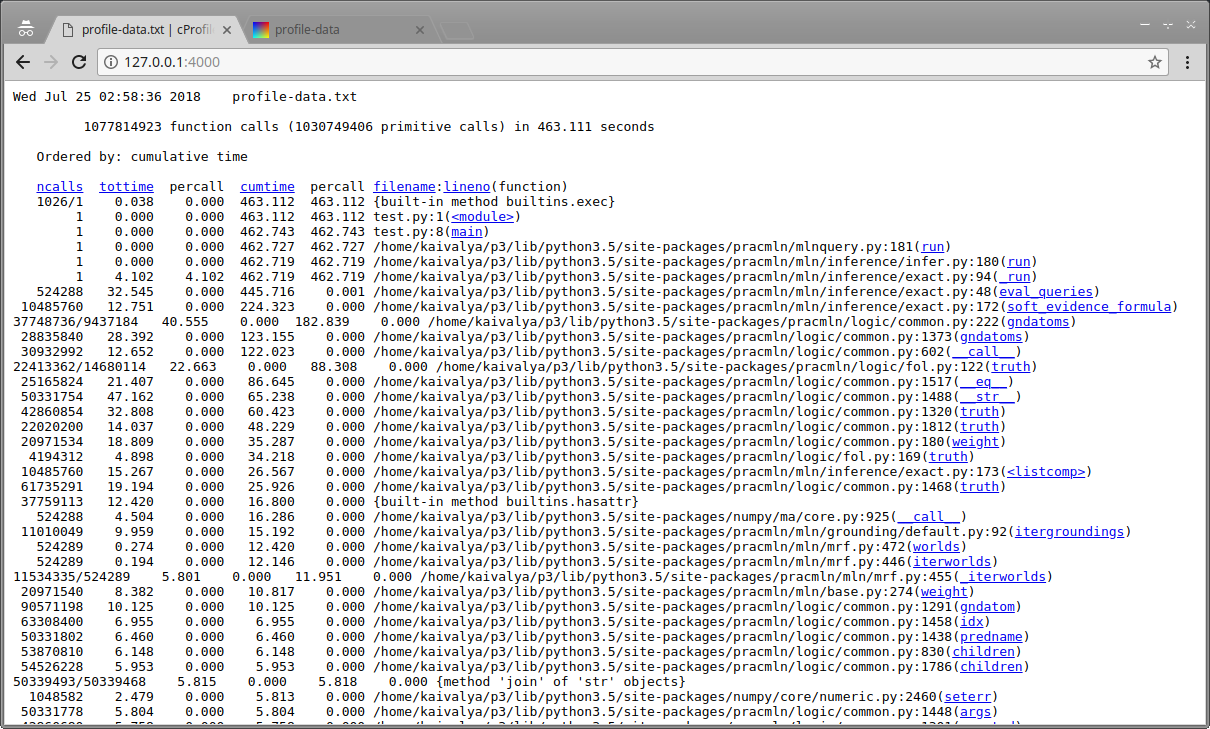
Screenshot of cprofilev Analysis of Enumeration-Ask
... $ snakeviz profile-data.txt
snakeviz web server started on 127.0.0.1:8080; enter Ctrl-C to exit
snakeviz provides a graphical view - a very intuitive GUI, instantly displaying function calls, and time taken per call. This ‘sunburst’ view shows topmost function in the callstack is at the center, and the outer rings around it represent successive function calls, with the arc angle representing total time. There is an equally neat ‘icicle’ view too.
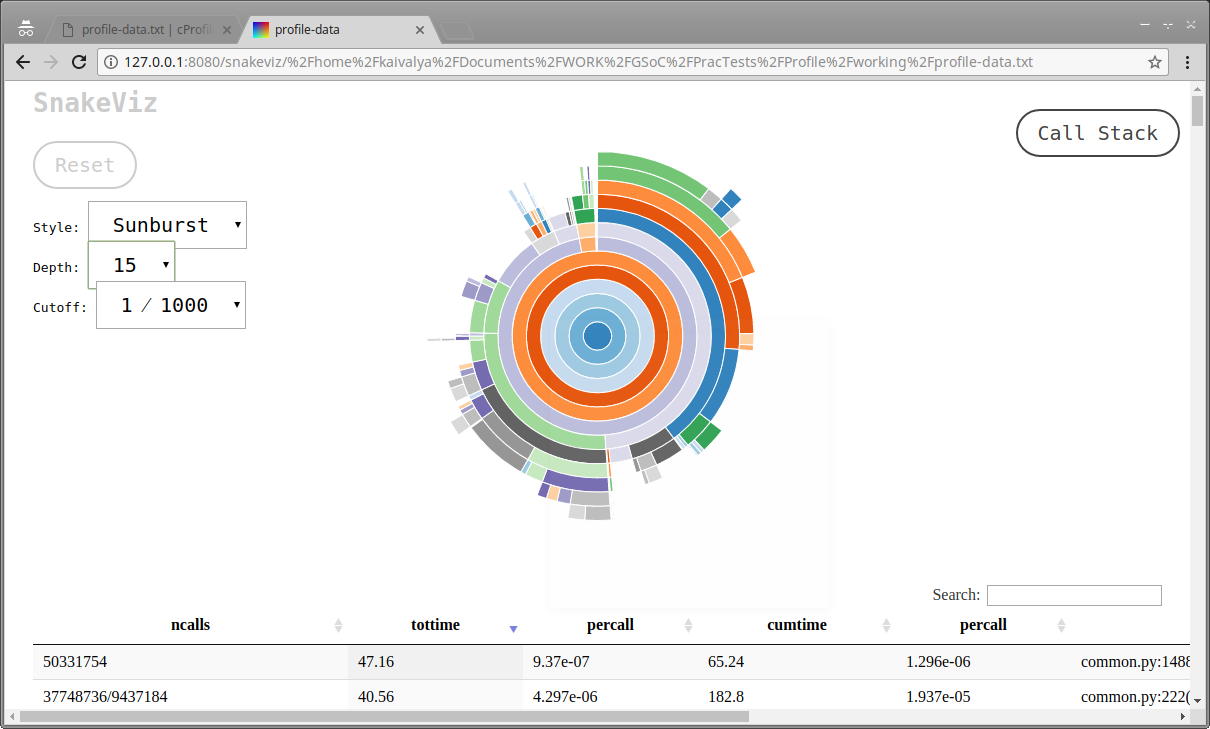
Screenshot of snakeviz Analysis of Enumeration-Ask
Profiling Cython
Unfortunately, all the tools described in the post so far, don’t work out of the box for Cython instead of Python. The Cython documentation has a little information on how to enable this though - it involves a compiler directive in every single Cython source file!
If you’re anything like me, this is way too tedious to implement. So the secret to getting around this is modifying the Cython compilation file - setup.py instead. I just added a compiler_directives={'profile': True} parameter to the cythonize( ... ) function. Since there were multiple setup.py files in PracMLN, this change needed to be made in all of them.
This completes it - I now have the ability to profile PracMLN code, and identify bottlenecks to optimise via Cython.